Project virtualizations on Tableau
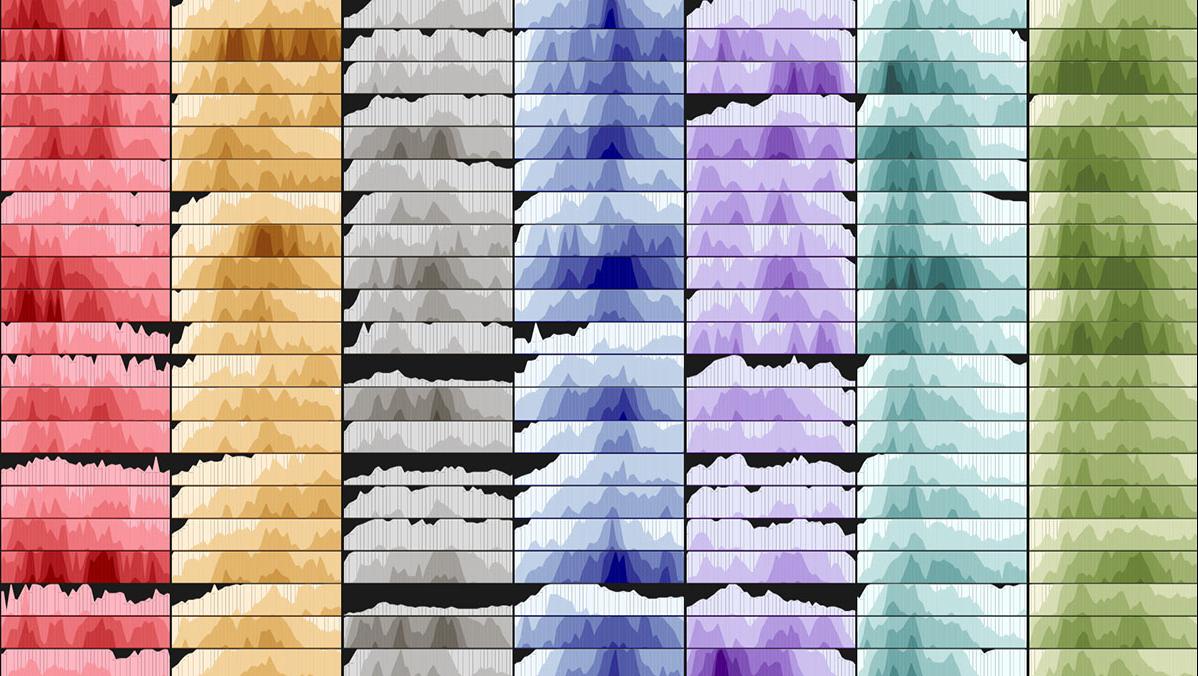
The following are different types of virtualization of data from different data sets, they are named accordingly.
An aspiring data analyst/scientist with an Applied Mathematics and Computer Science background.
The following are different types of virtualization of data from different data sets, they are named accordingly.

On this project I worked with initial data from when COVID-19 was being recognised as a world wide pandemic. I combined different data sets as one, conducted some calculations using SQL coding syntext.

Project on data analysis was facilitated by EntryLevel. It encorporates the tools to analyse data using excel/googlesheets and tableau. The project used data from Udemy for the learning process and New York City Air Bnb from 2019 data for a personal project.

Project in SQL where data from Nashville houses was used. Cleaning data involved standardizing of dates, populating columns, breaking column content into different columns, changing column content using case statement, removing duplicates and deleting unused columns.

Project used the Global stores data of 2018. In this analysis I used tableau to do data cleaning, calculations and created a dashboard analysing the profit gains.Project involved exploring virtualizations of world maps with the associated data,and more. The worksheet is available upon request.
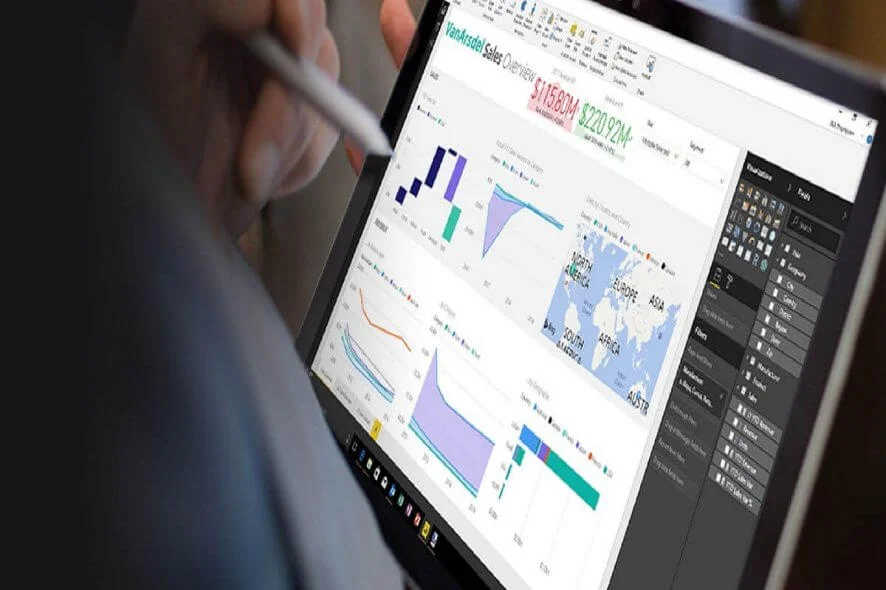
Project involved data reports using Microsoft PowerBI in which data from Global Super Store was used. The two reports showcase usage of basic default charts as well as outsourced charts. The worksheet of the project is available on request.

Show casing Udemy data provided project being cleaned, updated and packed using google sheets is available here. More projects conducted on google sheets are available upon request.